Notebook reviews with NVIDIA GeForce RTX 3070 Ti Laptop GPU graphics card
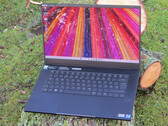
Razer Blade 15 OLED (early 2022) review: A compact gaming laptop with an RTX 3070 Ti
The current incarnation of the Blade 15 still continues to rely on potent Alder Lake and Ampere hardware but also offers an enticing upgrade: Razer has gone for a high-contrast OLED display (QHD) complete with a high refresh rate (240 Hz) and excellent color space coverage.
Intel Core i9-12900H, NVIDIA GeForce RTX 3070 Ti Laptop GPU, 15.6", 2 kgAsus ProArt StudioBook 16 H7600ZW Review: The definitive MacBook Pro alternative for content creators
Asus tries to woo the MacBook Pro audience with the ProArt StudioBook 16 featuring a Core i9-12900H and RTX 3070 Ti combination mated to a vivid 16-inch 4K OLED panel, good emission profiles, and a very handy Asus Dial. We pit the Asus ProArt StudioBook 16 against the competition and tell you if this laptop merits a place in your creative arsenal.
Intel Core i9-12900H, NVIDIA GeForce RTX 3070 Ti Laptop GPU, 16", 2.4 kgAsus ROG Zephyrus M16 laptop review: A well-rounded gaming package
With a Core i9-12900H, RTX 3070 Ti, and DDR5 RAM, the Zephyrus M16 contains some powerful hardware. Our extensive test shows whether the gaming laptop is still able to impress toward the end of the Alder Lake and RTX 30xx generation.
Intel Core i9-12900H, NVIDIA GeForce RTX 3070 Ti Laptop GPU, 16", 2.1 kgAorus 15 XE5 review: Compact QHD gaming laptop with Thunderbolt 4
With the Aorus 15 XE5, Gigabyte is bringing another 15.6-inch compact gaming notebook to the market. Amongst other things, the laptop shines with its impressive performance (in both gaming and non-gaming applications) and its ability to accommodate two PCIe 4.0 SSDs.
Intel Core i7-12700H, NVIDIA GeForce RTX 3070 Ti Laptop GPU, 15.6", 2.3 kgSchenker Vision 16 Pro Laptop Review - Lightweight 16-inch Ultrabook with RTX 3070 Ti
Schenker’s new Vision 16 Pro is a 16-inch multimedia laptop with a weight of just 1.6 kg. This does not mean it lacks performance and the 240 Hz WQHD panel is powered by the current Alder Lake Core i7-12700H as well as the GeForce RTX 3070 Ti.
Intel Core i7-12700H, NVIDIA GeForce RTX 3070 Ti Laptop GPU, 16", 1.7 kgAcer Predator Helios 300 (i7-12700H, RTX 3070 Ti): Intel Core i7-12700H, 17.30", 3 kg
Review » Acer Predator Helios 300 review: Overclocked gaming laptop with a good display
Schenker XMG Neo 15 (Ryzen 9 6900HX, RTX 3070 Ti): AMD Ryzen 9 6900HX, 15.60", 2.3 kg
Review » Schenker XMG Neo 15 gaming laptop review: Ryzen 6000 with liquid cooling ports
Acer Nitro 5 AN515-46-R1A1: AMD Ryzen 7 6800H, 15.60", 2.5 kg
Review » Acer Nitro 5 AN515-46 review: powerful FHD gaming with USB 4
Lenovo Legion 5 Pro 16ARH7H RTX 3070 Ti: AMD Ryzen 7 6800H, 16.00", 2.6 kg
Review » Lenovo Legion 5 Pro Gen 7 laptop review: Ryzen 7 6800H or Ryzen 9 6900HX?
MSI Creator Z17 A12UGST-054: Intel Core i9-12900H, 17.00", 2.5 kg
Review » MSI Creator Z17 Laptop review: What are creatives and gamers getting for around 4,000 Euro?
HP Omen 17-ck1075ng: Intel Core i7-12700H, 17.30", 2.8 kg
Review » HP Omen 17 (2022) gaming laptop in review: Stylish case and hardware with lots of potential
Aorus 17X XES: Intel Core i9-12900HX, 17.30", 2.7 kg
Review » Aorus 17X XES review: Gaming laptop with an i9-12900HX offers top performance
Asus ROG Flow X16 GV601RW-M5082W: AMD Ryzen 9 6900HS, 16.10", 2.1 kg
Review » Asus ROG Flow X16 laptop review: 2-in-1 gamer with mini-LED
MSI GE67 HX 12UGS: Intel Core i7-12800HX, 15.60", 2.5 kg
Review » The Intel Core i7-12800HX is insane: MSI Raider GE67 HX 12UGS laptop review
Eurocom Raptor X15: Intel Core i7-12700K, 15.60", 2.7 kg
Review » Eurocom Raptor X15 review: LGA1700 Core i7-12700K in a laptop
Acer Nitro 5 AN515-58-72QR: Intel Core i7-12700H, 15.60", 2.5 kg
Review » Acer Nitro 5 AN515-58 review: Fast QHD gaming notebook
MSI Katana GF66 12UGS: Intel Core i7-12700H, 15.60", 2.3 kg
Review » MSI Katana GF66 12UGS laptop review: The update to Alder Lake brings significantly more performance
Asus ROG Strix Scar 15 G533ZW-LN106WS: Intel Core i9-12900H, 15.60", 2.3 kg
Review » Asus ROG Strix Scar 15 G533ZW Laptop Review: 1440p 240 Hz gaming powerhouse with Alder Lake Core i9 and 150 W RTX 3070 Ti
MSI Katana GF76 12UGS: Intel Core i7-12700H, 17.30", 2.7 kg
Review » MSI Katana GF76 12UGS review: Is one of the most affordable RTX 3070 Ti gaming laptops worth it?
MSI Vector GP76 12UGS-434: Intel Core i7-12700H, 17.30", 2.9 kg
Review » MSI Vector GP76 12UGS review: Gaming laptop on speed
Razer Blade 17 (i7-12800H, RTX 3070 Ti): Intel Core i7-12800H, 17.30", 2.8 kg
Review » Razer Blade 17 laptop review: RTX 3070 Ti or RTX 3080 Ti - Which is the superior Blade?
Razer Blade 14 Ryzen 9 6900HX: AMD Ryzen 9 6900HX, 14.00", 1.8 kg
Review » AMD Ryzen 9 6900HX debut: Razer Blade 14 laptop review
HP Omen 16-b1090ng: Intel Core i7-12700H, 16.10", 2.3 kg
Review » HP Omen 16 (2022) review: Slick gaming laptop with high-resolution 165 Hz display
Aorus 17 XE4: Intel Core i7-12700H, 17.30", 2.6 kg
Review » Aorus 17 XE4 Review: Potent Gaming Notebook with 360 Hz Screen
Lenovo Legion 5 Pro 16 G7 i7 RTX 3070Ti: Intel Core i7-12700H, 16.00", 2.6 kg
Review » Lenovo Legion 5i Pro 16 G7 Review: Gaming Laptop now with Alder Lake and RTX 3070 Ti
MSI Vector GP66 12UGS: Intel Core i9-12900H, 15.60", 2.3 kg
Review » MSI Vector GP66 12UGS laptop review: 150 W TGP GeForce RTX 3070 Ti sweet spot
MSI Stealth GS66 12UGS: Intel Core i7-12700H, 15.60", 2.2 kg
Review » MSI Stealth GS66 12UGS gaming laptop review: Powerful enough for QHD
Acer Predator Helios 300 PH317-56-72QY: Intel Core i7-12700H, 17.30", 3 kg
External Review » Acer Predator Helios 300 PH317-56-72QY
HP ZBook Studio 16 G9, i7-12700H RTX 3070 Ti: Intel Core i7-12700H, 16.00", 1.7 kg
External Review » HP ZBook Studio 16 G9, i7-12700H RTX 3070 Ti
Acer Predator Helios 300 PH315-55-98R7: Intel Core i9-12900H, 15.60", 2.6 kg
External Review » Acer Predator Helios 300 PH315-55-98R7
Razer Blade 15 OLED (Early 2022): Intel Core i9-12900H, 15.60", 2 kg
External Review » Razer Blade 15 OLED (Early 2022)
HP Omen 16-k0097ng: Intel Core i9-12900H, 16.10", 2.4 kg
External Review » HP Omen 16-k0097ng
HP Omen 17-ck1075ng: Intel Core i7-12700H, 17.30", 2.8 kg
External Review » HP Omen 17-ck1075ng
Acer ConceptD 5 CN516-73G-70XD: Intel Core i7-12700H, 16.00", 2.4 kg
External Review » Acer ConceptD 5 CN516-73G-70XD
Razer Blade 17 (i7-12800H, RTX 3070 Ti): Intel Core i7-12800H, 17.30", 2.8 kg
External Review » Razer Blade 17 (i7-12800H, RTX 3070 Ti)
HP Omen 16-k0168ng: Intel Core i7-12700H, 16.10", 2.4 kg
External Review » HP Omen 16-k0168ng
MSI Raider GE77 HX 12UGS: Intel Core i7-12800HX, 17.30", 2.9 kg
External Review » MSI Raider GE77 HX 12UGS
MSI Vector GP66 12UGSO-671RU: Intel Core i7-12700H, 15.60", 2.4 kg
External Review » MSI Vector GP66 12UGSO-671RU
Lenovo Legion 7 16IAX7-82TD0075GE: Intel Core i7-12800HX, 16.00", 2.5 kg
External Review » Lenovo Legion 7 16IAX7-82TD0075GE
HP Omen 16-n0007ns: AMD Ryzen 9 6900HX, 16.10", 2.3 kg
External Review » HP Omen 16-n0007ns
HP Omen 16-n0598nd: AMD Ryzen 9 6900HX, 16.00", 2.3 kg
External Review » HP Omen 16-n0598nd
MSI Vector GP76 12UGS-491ES: Intel Core i7-12700H, 17.30", 2.8 kg
External Review » MSI Vector GP76 12UGS-491ES
Asus ROG Strix Scar 17 SE G733CW-LL044W: Intel Core i9-12950HX, 17.30", 2.9 kg
External Review » Asus ROG Strix Scar 17 SE G733CW-LL044W
Lenovo Legion 5 Pro 16ARH7H RTX 3070 Ti: AMD Ryzen 7 6800H, 16.00", 2.6 kg
External Review » Lenovo Legion 5 Pro 16ARH7H RTX 3070 Ti
Acer Predator Triton 300 SE PT316-51s-74RM: Intel Core i7-12700H, 16.00", 2.4 kg
External Review » Acer Predator Triton 300 SE PT316-51s-74RM
Lenovo ThinkPad X1 Extreme G5, i7-12800H RTX 3070 Ti: Intel Core i7-12800H, 16.00", 1.9 kg
External Review » Lenovo ThinkPad X1 Extreme G5, i7-12800H RTX 3070 Ti
Lenovo Legion 5 Pro 16IAH7H, i9-12900H RTX 3070 Ti: Intel Core i9-12900H, 16.00", 2.5 kg
External Review » Lenovo Legion 5 Pro 16IAH7H, i9-12900H RTX 3070 Ti
Asus ROG Strix G17 G713RW-LL009: AMD Ryzen 9 6900HX, 17.30", 2.8 kg
External Review » Asus ROG Strix G17 G713RW-LL009
Acer Predator Helios 300 PH315-55-764C: Intel Core i7-12700H, 15.60", 2.6 kg
External Review » Acer Predator Helios 300 PH315-55-764C
Gigabyte Aero 16 XE5: Intel Core i7-12700H, 16.00", 2.3 kg
External Review » Gigabyte Aero 16 XE5
Razer Blade 15 2022 RZ09-0421NGG3-R3G1: Intel Core i9-12900H, 15.60", 2 kg
External Review » Razer Blade 15 2022 RZ09-0421NGG3-R3G1
Acer Predator Helios 300 PH315-55-902L: Intel Core i9-12900H, 15.60", 2.6 kg
External Review » Acer Predator Helios 300 PH315-55-902L
Lenovo Legion 5 Pro 16 G7 i7 RTX 3070Ti: Intel Core i7-12700H, 16.00", 2.6 kg
External Review » Lenovo Legion 5 Pro 16 G7 i7 RTX 3070Ti
Acer Nitro 5 AN515-46-R606: AMD Ryzen 7 6800H, 15.60", 2.5 kg
External Review » Acer Nitro 5 AN515-46-R606
Dell G15 5520, i7-12700H RTX 3070 Ti: Intel Core i7-12700H, 15.60", 2.7 kg
External Review » Dell G15 5520, i7-12700H RTX 3070 Ti
Acer Predator Helios 300 PH315-55-766X: Intel Core i7-12700H, 15.60", 2.4 kg
External Review » Acer Predator Helios 300 PH315-55-766X
MSI Raider GE76 12UGS-018NL: Intel Core i7-12700H, 17.30", 2.9 kg
External Review » MSI Raider GE76 12UGS-018NL
Alienware x15 R2 YMGXH: Intel Core i7-12700H, 15.60", 2.5 kg
External Review » Alienware x15 R2 YMGXH
Asus ROG Flow X16 GV601RW-M5093W: AMD Ryzen 7 6800HS, 16.00", 2.1 kg
External Review » Asus ROG Flow X16 GV601RW-M5093W
MSI Creator Z16P B12UGST: Intel Core i9-12900H, 16.00", 2.4 kg
External Review » MSI Creator Z16P B12UGST
MSI Raider GE67 HX 12UGS-002: Intel Core i7-12800HX, 15.60", 2.4 kg
External Review » MSI Raider GE67 HX 12UGS-002
MSI Raider GE76 12UGS-070: Intel Core i7-12800HX, 15.60", 2.9 kg
External Review » MSI Raider GE76 12UGS-070
MSI Stealth GS66 12UGS-025: Intel Core i9-12900H, 15.60", 2.1 kg
External Review » MSI Stealth GS66 12UGS-025
MSI Stealth GS77 12UH-088ES: Intel Core i7-12700H, 17.30", 2.8 kg
External Review » MSI Stealth GS77 12UH-088ES
Lenovo Legion 5 Pro 16IAH7H-82RF000TUS: Intel Core i7-12700H, 16.00", 2.5 kg
External Review » Lenovo Legion 5 Pro 16IAH7H-82RF000TUS
Acer Predator Helios 300 PH315-55-79FW: Intel Core i7-12700H, 15.60", 2.6 kg
External Review » Acer Predator Helios 300 PH315-55-79FW
Asus ROG Flow X16 GV601RW-M5082W: AMD Ryzen 9 6900HS, 16.10", 2.1 kg
External Review » Asus ROG Flow X16 GV601RW-M5082W
MSI Katana GF66 12UGS: Intel Core i7-12700H, 15.60", 2.3 kg
External Review » MSI Katana GF66 12UGS
Alienware m17 R5, 6900HX RTX 3070 Ti : AMD Ryzen 9 6900HX, 17.30", 3.3 kg
External Review » Alienware m17 R5, 6900HX RTX 3070 Ti
Asus Zephyrus G15 GA503RW-LN030W: AMD Ryzen 9 6900HS, 15.60", 1.9 kg
External Review » Asus Zephyrus G15 GA503RW-LN030W
MSI Vector GP66 12UGS-207XFR: Intel Core i7-12700H, 15.60", 2.4 kg
External Review » MSI Vector GP66 12UGS-207XFR
MSI Vector GP76 12UGS-618: Intel Core i9-12900HK, 17.30", 2.8 kg
External Review » MSI Vector GP76 12UGS-618
Razer Blade 14 Ryzen 9 6900HX: AMD Ryzen 9 6900HX, 14.00", 1.8 kg
External Review » Razer Blade 14 Ryzen 9 6900HX
HP Omen 16-b1090ng: Intel Core i7-12700H, 16.10", 2.3 kg
External Review » HP Omen 16-b1090ng
Aorus 15 XE5: Intel Core i7-12700H, 15.60", 2.3 kg
External Review » Aorus 15 XE5
MSI Creator Z17 A12UGST-049: Intel Core i7-12700H, 17.30", 2.5 kg
External Review » MSI Creator Z17 A12UGST-049
Aorus 15 XE4: Intel Core i7-12700H, 15.60", 2.4 kg
External Review » Aorus 15 XE4
Acer Predator Helios 300 PH317-56-718D: Intel Core i7-12700H, 17.30", 3 kg
External Review » Acer Predator Helios 300 PH317-56-718D
Asus ROG Strix Scar 15 G533ZW-AS94: Intel Core i9-12900H, 15.60", 2.4 kg
External Review » Asus ROG Strix Scar 15 G533ZW-AS94
Razer Blade 15 RZ09-0421NGD3-R3G1: Intel Core i7-12800H, 15.60", 2 kg
External Review » Razer Blade 15 RZ09-0421NGD3-R3G1
Asus ROG Strix G17 G713RW-LL103W: AMD Ryzen 9 6900HX, 17.30", 2.8 kg
External Review » Asus ROG Strix G17 G713RW-LL103W
Asus ROG Strix G15 G513RW-HQ021W: AMD Ryzen 9 6900HX, 15.60", 2.3 kg
External Review » Asus ROG Strix G15 G513RW-HQ021W
MSI Stealth GS77 12UGS-065: Intel Core i7-12700H, 17.30", 2.8 kg
External Review » MSI Stealth GS77 12UGS-065
MSI Raider GE76 12UGS-493: Intel Core i7-12700H, 17.30", 2.9 kg
External Review » MSI Raider GE76 12UGS-493
Acer Nitro 5 AN517-55-78NJ: Intel Core i7-12700H, 17.30", 3 kg
External Review » Acer Nitro 5 AN517-55-78NJ
Alienware m15 R7-D8YK4: Intel Core i7-12700H, 15.60", 2.7 kg
External Review » Alienware m15 R7-D8YK4
Lenovo Legion 5 Pro 16IAH7H-82RF000VGE: Intel Core i7-12700H, 16.00", 2.5 kg
External Review » Lenovo Legion 5 Pro 16IAH7H-82RF000VGE
Acer Predator Triton 500 SE PT516-52s-73YD: Intel Core i7-12700H, 16.00", 2.4 kg
External Review » Acer Predator Triton 500 SE PT516-52s-73YD
MSI Stealth GS66 12UGS: Intel Core i7-12700H, 15.60", 2.2 kg
External Review » MSI Stealth GS66 12UGS
Asus ROG Zephyrus M16 GU603ZW-K8062W: Intel Core i9-12900H, 16.00", 1.9 kg
External Review » Asus ROG Zephyrus M16 GU603ZW-K8062W
Asus ROG Strix Scar 15 G533ZW-LN106WS: Intel Core i9-12900H, 15.60", 2.3 kg
External Review » Asus ROG Strix Scar 15 G533ZW-LN106WS
Asus ROG Strix Scar 15 G533ZW-LN017W: Intel Core i9-12900H, 15.60", 2.4 kg
External Review » Asus ROG Strix Scar 15 G533ZW-LN017W
Aorus 17 XE4: Intel Core i7-12700H, 17.30", 2.6 kg
External Review » Aorus 17 XE4
MSI Vector GP76 12UGS-434: Intel Core i7-12700H, 17.30", 2.9 kg
External Review » MSI Vector GP76 12UGS-434
Acer Predator Helios 300 PH305-55: Intel Core i7-12700H, 15.60", 2.5 kg
External Review » Acer Predator Helios 300 PH305-55
Asus ROG Strix G17 G733ZW-LL103W: Intel Core i9-12900H, 17.30", 2.9 kg
External Review » Asus ROG Strix G17 G733ZW-LL103W
Alienware x17 R2, i7-12700H 3070 Ti 4K: Intel Core i7-12700H, 17.30", 3.1 kg
External Review » Alienware x17 R2, 12900HK 3080 Ti FHD
Acer Nitro 5 AN515-58-75UH: Intel Core i7-12700H, 15.60", 2.5 kg
External Review » Acer Nitro 5 AN515-58-75UH
MSI GE66 Raider 10UG-605ES: Intel Core i7-10870H, 15.60", 2.4 kg
External Review » MSI GE66 Raider 10UG-605ES
Acer Nitro 5 AN515-46-R1A1: AMD Ryzen 7 6800H, 15.60", 2.5 kg
» Acer Nitro 5 gaming laptop with RTX 3070 Ti, AMD Ryzen 7 6800H and QHD display drops to US$969
Dell G15 5520, i7-12700H RTX 3070 Ti: Intel Core i7-12700H, 15.60", 2.7 kg
» Dell G15 gaming laptop with RTX 3070 Ti, Core i9-12900H and 240Hz QHD display on sale for 29% off thanks to coupon code
Lenovo Legion 5 Pro 16ARH7H RTX 3070 Ti: AMD Ryzen 7 6800H, 16.00", 2.6 kg
» Lenovo Legion 5 Pro gaming laptop with RTX 3070 Ti, 165Hz QHD display and Ryzen 7 on sale for a limited time
Gigabyte Aero 16 XE5: Intel Core i7-12700H, 16.00", 2.3 kg
» Gigabyte Aero 16 4K OLED gaming laptop with RTX 3070 Ti gets whopping 52% discount
Acer Predator Helios 300 PH315-55-79FW: Intel Core i7-12700H, 15.60", 2.6 kg
» Acer Predator Helios 300 gaming laptop with RTX 3070 Ti gets 33% discount for a limited time
Asus ROG Zephyrus M16 GU603Z: Intel Core i9-12900H, 16.00", 2.1 kg
» Asus ROG Zephyrus M16 (2022) test: A great gaming laptop with well-rounded equipment
Aorus 15 XE5: Intel Core i7-12700H, 15.60", 2.3 kg
» Aorus 15 XE5: Excellent gaming performance, excessive power consumption
Schenker Vision 16 Pro RTX 3070 Ti: Intel Core i7-12700H, 16.00", 1.7 kg
» Schenker’s Vision 16 Pro shows that a lightweight laptop does not have to sacrifice performance, ports, or maintenance options
Acer Nitro 5 AN515-46-R1A1: AMD Ryzen 7 6800H, 15.60", 2.5 kg
» Acer Nitro 5 AN515-46: cool FHD gaming notebook with decent battery life
Lenovo Legion 5 Pro 16ARH7H RTX 3070 Ti: AMD Ryzen 7 6800H, 16.00", 2.6 kg
» The Ryzen 9 6900HX is a waste of money when compared to the Ryzen 7 6800H and the benchmarks are proof
HP Omen 17-ck1075ng: Intel Core i7-12700H, 17.30", 2.8 kg
» HP Omen 17 reviewed: Gaming notebook fails to arouse enthusiasm
Aorus 17X XES: Intel Core i9-12900HX, 17.30", 2.7 kg
» Too powerful i9-12900HX consumes resources: Aorus 17X XES gaming laptop
Asus ROG Flow X16 GV601RW-M5082W: AMD Ryzen 9 6900HS, 16.10", 2.1 kg
» Asus ROG Flow X16 laptop in review: 1,100 nits mini-LED display in gaming convertible with Ryzen 9 6900HS
MSI GE67 HX 12UGS: Intel Core i7-12800HX, 15.60", 2.5 kg
» The MSI Raider GE67 330 W AC adapter is so fat that it's heavier than some 15-inch laptops
Acer Nitro 5 AN515-58-72QR: Intel Core i7-12700H, 15.60", 2.5 kg
» Acer Nitro 5 AN515-58: QHD gaming notebook with room for three drives
MSI Katana GF66 12UGS: Intel Core i7-12700H, 15.60", 2.3 kg
» MSI Katana GF66 test: New hardware but old problem areas
MSI Katana GF76 12UGS: Intel Core i7-12700H, 17.30", 2.7 kg
» MSI Katana GF76 test: RTX 3070 Ti for less than 2000 Euros (~$2084)
Razer Blade 17 (i7-12800H, RTX 3070 Ti): Intel Core i7-12800H, 17.30", 2.8 kg
» Razer Blade 17 RTX 3080 Ti versus Razer Blade 17 RTX 3070 Ti - Which is the better laptop?
MSI Vector GP76 12UGS-434: Intel Core i7-12700H, 17.30", 2.9 kg
» MSI Vector GP76 gaming laptop review: Fastest laptop display? 360 Hz and 4ms meet a 150 watt RTX 3070 Ti
Razer Blade 14 Ryzen 9 6900HX: AMD Ryzen 9 6900HX, 14.00", 1.8 kg
» AMD Ryzen 9 6900HX vs. Core i7-12800H: Intel still has the edge
Aorus 17 XE4: Intel Core i7-12700H, 17.30", 2.6 kg
» Aorus 17 XE4: This compact gaming machine offers Thunderbolt 4
Lenovo Legion 5 Pro 16 G7 i7 RTX 3070Ti: Intel Core i7-12700H, 16.00", 2.6 kg
» Lenovo's new Legion 5i Pro 16 G7 with the RTX 3070 Ti is a very good Gaming Laptop
MSI Vector GP66 12UGS: Intel Core i9-12900H, 15.60", 2.3 kg
» MSI GP66 Leopard vs. Vector GP66: What's the difference?
MSI Stealth GS66 12UGS: Intel Core i7-12700H, 15.60", 2.2 kg
» The RTX 3070 Ti's debut: MSI Stealth GS66